Some key definitions related to quantile regression are introduced in this section. Besides that, we demonstrate how to use XploRe for the estimation of quantile regression models.
Given a random sample
![]() , it seems natural to find the approximation
of a quantile (e.g., the median
, it seems natural to find the approximation
of a quantile (e.g., the median ![]() ), in terms of the order statistics
), in terms of the order statistics
![]() , i.e., by means of sorting.
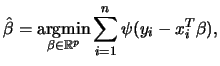
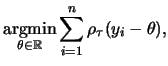
The crucial point for the concept of quantile regression estimation is that the
sample analogue of
, i.e., by means of sorting.
The crucial point for the concept of quantile regression estimation is that the
sample analogue of ![]() can be also found as the argument of the minimum
of a specific objective function, because the optimization approach yields a natural
generalization of the quantiles to the regression context. The
can be also found as the argument of the minimum
of a specific objective function, because the optimization approach yields a natural
generalization of the quantiles to the regression context. The ![]() -th
sample quantile can be found as
-th
sample quantile can be found as
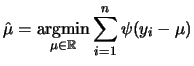
Any one-dimensional ![]() -statistics (including the least squares
estimator and (1.5)) for estimating a parameter of location
-statistics (including the least squares
estimator and (1.5)) for estimating a parameter of location
Before proceeding to the description of how such an estimate can be computed in
XploRe
, two issues have to be discussed.
First, given formula (1.7),
it is clear that in most cases there exists no general
closed-form solution like in
the case of the least squares estimator. Therefore, it is natural to ask whether
any solution of (1.7) exists at all and whether it is unique. The
answer is positive under some rather general conditions. Let
![]() represent the set of all
represent the set of all ![]() -element subsets of
-element subsets of
![]() , and let
, and let ![]() denote a
denote a
![]() submatrix of
submatrix of ![]() composed from rows
composed from rows
![]() for any
for any
![]() and
and
![]() .
Similarly, let for a vector
.
Similarly, let for a vector ![]() be
be
![]() . Notice that this convention applies also for
. Notice that this convention applies also for
![]() , that is, for single numbers. The rows of
, that is, for single numbers. The rows of ![]() taken as column vectors are
referred by
taken as column vectors are
referred by
![]() --therefore,
--therefore,
![]() .
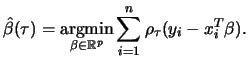
Now we can write Theorem 3.3 of Koenker and Bassett (1978) in the following way:
.
Now we can write Theorem 3.3 of Koenker and Bassett (1978) in the following way:
Let ![]() be regression observations,
be regression observations,
![]() .
If
.
If ![]() are in general position, i.e., the system of linear equations
are in general position, i.e., the system of linear equations
![]() has
no solution for any
has
no solution for any
![]() , then there exists a solution to the
quantile regression problem (1.7) of the form
, then there exists a solution to the
quantile regression problem (1.7) of the form
![]() if and only if for some
if and only if for some
![]() holds
holds
The presented result deserves one additional remark. Whereas
situations in which observations ![]() are not in general position
are not very frequent unless the response variable is of discrete nature,
weak inequality in (1.8), and consequently multiple optimal solutions,
can occur when all explanatory variables are discrete.
are not in general position
are not very frequent unless the response variable is of discrete nature,
weak inequality in (1.8), and consequently multiple optimal solutions,
can occur when all explanatory variables are discrete.
The second issue we have to mention is related to the numerical computation of estimates. The solution of (1.7) can be found by techniques of the linear programming, because
|
The quantlet of
metrics
quantlib which serves for
the quantile regression estimation is
 rqfit
.
We explain just the basic usage of
rqfit
quantlet in this section,
other features will be discussed in the following sections.
See Subsection 1.5.1 for detailed description of the quantlet.
rqfit
.
We explain just the basic usage of
rqfit
quantlet in this section,
other features will be discussed in the following sections.
See Subsection 1.5.1 for detailed description of the quantlet.
The quantlet expects at least two input parameters: an
![]() matrix x that contains
matrix x that contains ![]() observations of
observations of ![]() explanatory
variables and an
explanatory
variables and an
![]() vector y of
vector y of ![]() observed responses.
If the intercept is to be included in the regression model,
the
observed responses.
If the intercept is to be included in the regression model,
the
![]() vector of ones can be concatenated to the matrix
x in the following way:
vector of ones can be concatenated to the matrix
x in the following way:
x = matrix(rows(x))~xNeither the matrix x, nor the vector y should contain missing (NaN) or infinite values (Inf,-Inf). Their presence can be identified by
isNaN
or
isNumber
and the invalid observations should be processed before running
rqfit
,
e.g., omitted using
paf
.
Quantlet
rqfit
provides a noninteractive way for quantile regression
estimation. The basic invocation method is quite simple:
z = rqfit(x,y,tau)where parameter tau indicates which conditional quantile function
z = rqfit(x,y)In this case, the predefined value
rqfit
might be little bit
too complex, but for now it is sufficient to note that z.coefs refers to the vector of the estimated coefficients
rqfit
--the fourth one, ci, equal to one, which
indicates that you want to get confidence intervals, and optionally the fifth one, alpha, that specifies
the nominal coverage probability
1-alpha
for the confidence intervals (the default value of alpha is 0.1):
z = rqfit(x,y,tau,1,alpha)Then z.intervals gives you the access to the
To have a real example, let us use data set
nicfoo
supplied with
XploRe
. The data set is two-dimensional, having only one explanatory variable
x, a household's net income, in the first column and the
response variable
y, food expenditures of the household, in the second column.
In order to run, for
example, the median regression (
![]() ) of y on constant term,
x and x
) of y on constant term,
x and x![]() , you have to type at the command line or
in the editor window
, you have to type at the command line or
in the editor window
  data = read("nicfoo")
  x = matrix(rows(data)) ~ data[,1] ~ (data[,1]^2)
  y = data[,2]
  z = rqfit(x,y)
  z.coefs
rqfit
:
library("metrics")
The result of the above example should appear in the
XploRe
output
window as follows:
  Contents of coefs
  [1,]  0.12756
  [2,]   1.1966
  [3,] -0.24616
![\includegraphics[scale=1]{rotau}](xaghtmlimg69.gif)