Sliced inverse regression (SIR) is
a dimension reduction method proposed by Duan and Li (1991).
The idea is to find a smooth regression function that operates on a
variable set of projections.
Given a response variable ![]() and a (random) vector
and a (random) vector
![]() of
explanatory variables, SIR is based on the model:
of
explanatory variables, SIR is based on the model:
Model (18.10) describes the situation where the response
variable ![]() depends on the
depends on the ![]() -dimensional variable
-dimensional variable ![]() only through
a
only through
a ![]() -dimensional subspace. The unknown
-dimensional subspace. The unknown ![]() 's, which span this
space, are called effective dimension reduction
directions
(EDR-directions). The span is denoted as effective dimension
reduction space
(EDR-space).
The aim is to estimate the base vectors of this space, for which
neither the length nor the direction can be identified.
Only the space in which they lie is identifiable.
's, which span this
space, are called effective dimension reduction
directions
(EDR-directions). The span is denoted as effective dimension
reduction space
(EDR-space).
The aim is to estimate the base vectors of this space, for which
neither the length nor the direction can be identified.
Only the space in which they lie is identifiable.
SIR tries to find this ![]() -dimensional subspace of
-dimensional subspace of
![]() which under the model (18.10)
carries the essential information of the regression between
which under the model (18.10)
carries the essential information of the regression between ![]() and
and ![]() .
SIR also focuses on small
.
SIR also focuses on small ![]() ,
so that nonparametric methods can be applied for the estimation
of
,
so that nonparametric methods can be applied for the estimation
of ![]() . A direct application of nonparametric smoothing to
. A direct application of nonparametric smoothing to ![]() is for high
dimension
is for high
dimension ![]() generally not possible due to the sparseness of the observations.
This fact is well known as the curse of dimensionality,
see Huber (1985).
generally not possible due to the sparseness of the observations.
This fact is well known as the curse of dimensionality,
see Huber (1985).
The name of SIR comes from computing the inverse regression (IR)
curve. That means instead of looking for
![]() , we investigate
, we investigate
![]() ,
a curve in
,
a curve in ![]() consisting of
consisting of ![]() one-dimensional regressions.
What is the connection between the IR and the SIR
model (18.10)? The answer is given in the following theorem
from Li (1991).
one-dimensional regressions.
What is the connection between the IR and the SIR
model (18.10)? The answer is given in the following theorem
from Li (1991).
Assumption (18.11) is equivalent to the fact that ![]() has
an elliptically symmetric distribution,
see Cook and Weisberg (1991). Hall and Li (1993)
have shown that
assumption (18.11) only needs to hold for the EDR-directions.
has
an elliptically symmetric distribution,
see Cook and Weisberg (1991). Hall and Li (1993)
have shown that
assumption (18.11) only needs to hold for the EDR-directions.
It is easy to see that for the standardized variable
![]() the IR curve
the IR curve
![]() lies in
lies in
![]() , where
, where
![]() . This means that the conditional
expectation
. This means that the conditional
expectation ![]() is moving in
is moving in
![]() depending on
depending on ![]() . With
. With ![]() orthogonal to
orthogonal to
![]() , it follows that
, it follows that
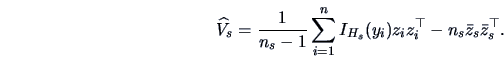
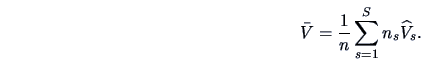
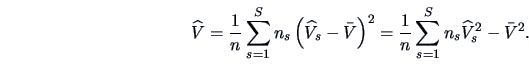
First, estimate
![]() and then calculate the orthogonal directions of this matrix (for
example, with eigenvalue/eigenvector decomposition).
In general, the
estimated covariance matrix will have full rank because of random
variability, estimation errors and numerical imprecision. Therefore,
we investigate the eigenvalues of the estimate and ignore eigenvectors
having small eigenvalues. These eigenvectors
and then calculate the orthogonal directions of this matrix (for
example, with eigenvalue/eigenvector decomposition).
In general, the
estimated covariance matrix will have full rank because of random
variability, estimation errors and numerical imprecision. Therefore,
we investigate the eigenvalues of the estimate and ignore eigenvectors
having small eigenvalues. These eigenvectors ![]() are
estimates for the EDR-direction
are
estimates for the EDR-direction ![]() of
of ![]() . We can easily
rescale them to estimates
. We can easily
rescale them to estimates ![]() for the EDR-directions of
for the EDR-directions of
![]() by multiplying by
by multiplying by
![]() , but then they are not
necessarily orthogonal.
SIR is strongly related to PCA. If
all of the data falls into a single interval, which means that
, but then they are not
necessarily orthogonal.
SIR is strongly related to PCA. If
all of the data falls into a single interval, which means that
![]() is equal to
is equal to
![]() , SIR
coincides with PCA. Obviously, in this case any information about
, SIR
coincides with PCA. Obviously, in this case any information about ![]() is ignored.
is ignored.
The conditional variance
The idea of SIR II is to consider the conditional covariances.
The principle of SIR II is the
same as before: investigation of the IR curve (here the conditional
covariance
instead of the conditional expectation).
Unfortunately, the theory of SIR II is more
complicated. The assumption of the elliptical symmetrical distribution
of ![]() has to be more restrictive, i.e., assuming the normality of
has to be more restrictive, i.e., assuming the normality of ![]() .
.
Given this assumption, one can show that the vectors with the largest
distance to
![]() for all
for all ![]() are the
most interesting for the EDR-space. An appropriate measure for the
overall mean distance is, according to Li (1992),
are the
most interesting for the EDR-space. An appropriate measure for the
overall mean distance is, according to Li (1992),
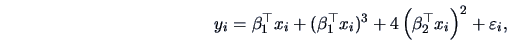
The data are generated according to the following model:
![\includegraphics[width=1\defpicwidth]{MVAsirdata1.ps}](mvahtmlimg4343.gif)
|
![\includegraphics[width=1\defpicwidth]{MVAsirdata2.ps}](mvahtmlimg4344.gif)
|
Both algorithms were conducted using the slicing
method with ![]() elements in each
slice. The goal was to find
elements in each
slice. The goal was to find ![]() and
and ![]() with
SIR. The data are designed such that
SIR can detect
with
SIR. The data are designed such that
SIR can detect ![]() because
of the monotonic shape of
because
of the monotonic shape of
![]() ,
while SIR II will search for
,
while SIR II will search for
![]() , as in this direction the conditional variance on
, as in this direction the conditional variance on ![]() is
varying.
is
varying.
|
![\includegraphics[width=1\defpicwidth]{MVAsirdata3.ps}](mvahtmlimg4351.gif)
|
If we normalize the eigenvalues for the EDR-directions in
Table 18.3 such that they sum up to one, the resulting
vector is
![]() . As can be seen in the upper left
plot of Figure 18.6, there is a functional relationship
found between the first index
. As can be seen in the upper left
plot of Figure 18.6, there is a functional relationship
found between the first index
![]() and the response.
Actually,
and the response.
Actually, ![]() and
and ![]() are nearly parallel, that is, the
normalized inner product
are nearly parallel, that is, the
normalized inner product
![]() is
very close to one.
is
very close to one.
The second direction along ![]() is probably found due to the
good approximation, but SIR does not provide it clearly, because it is ``blind''
with respect to the change of variance, as the second eigenvalue indicates.
is probably found due to the
good approximation, but SIR does not provide it clearly, because it is ``blind''
with respect to the change of variance, as the second eigenvalue indicates.
For SIR II, the normalized
eigenvalues are
![]() , that is, about 69% of the
variance is explained by the first EDR-direction
(Table 18.4). Here, the normalized inner product of
, that is, about 69% of the
variance is explained by the first EDR-direction
(Table 18.4). Here, the normalized inner product of
![]() and
and ![]() is
is ![]() . The
estimator
. The
estimator ![]() estimates in fact
estimates in fact ![]() of the simulated model.
In this case, SIR II found the direction where the second moment varies
with respect to
of the simulated model.
In this case, SIR II found the direction where the second moment varies
with respect to
![]() .
.
![\includegraphics[width=1\defpicwidth]{MVAsir2data.ps}](mvahtmlimg4361.gif)
|
|
In summary, SIR has found the direction which shows a strong relation
regarding the conditional expectation between
![]() and
and ![]() ,
and SIR II has found the direction where the conditional variance is
varying, namely,
,
and SIR II has found the direction where the conditional variance is
varying, namely,
![]() .
.
The behavior of the two SIR algorithms is as expected. In addition, we have seen that it is worthwhile to apply both versions of SIR. It is possible to combine SIR and SIR II (Schott; 1994; Li; 1991; Cook and Weisberg; 1991) directly, or to investigate higher conditional moments. For the latter it seems to be difficult to obtain theoretical results. For further details on SIR see Kötter (1996).