As an ''appetizer'' we give two simple examples of use of
transformations in statistics, Fisher ![]() and Box-Cox transformations
as well as the empirical Fourier-Stieltjes transform.
and Box-Cox transformations
as well as the empirical Fourier-Stieltjes transform.
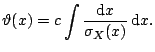 |
Let
![]() be a sample from
bivariate normal distribution
be a sample from
bivariate normal distribution
![]() , and
, and
![]() ,
,
![]() .
.
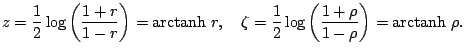
The Pearson coefficient of linear correlation
![$\displaystyle r = \frac{\sum_{i=1}^n (X_{1i} - \bar {X_1})(X_{2i}-\bar{X_2})} {...
..._1}\right)^2 \cdot \sum_{i=1}^n \left(X_{2i}- \bar{X_2}\right)^2\right]^{1/2} }$](img2330.gif) |
 |
||
 |
||
 |
 |
![\includegraphics[width=5.1cm]{text/2-7/figure1a.eps}](img2341.gif) (a) (a)
![\includegraphics[width=5.1cm]{text/2-7/figure1b.eps}](img2342.gif) (b) (b)
|
To exemplify the above, we generated ![]() pairs of normally
distributed random samples with theoretical correlation
pairs of normally
distributed random samples with theoretical correlation
![]() . This was done by generating two i.i.d. normal
samples
. This was done by generating two i.i.d. normal
samples ![]() , and
, and ![]() of length
of length ![]() and taking the transformation
and taking the transformation
![]() ,
, ![]() . The sample correlation coefficient
. The sample correlation coefficient ![]() is found.
This was repeated
is found.
This was repeated
![]() times. The histogram of
times. The histogram of
![]() sample correlation coefficients is shown in
Fig. 7.1a. The histogram of
sample correlation coefficients is shown in
Fig. 7.1a. The histogram of ![]() -transformed
-transformed ![]() 's is
shown in Fig. 7.1b with superimposed normal
approximation
's is
shown in Fig. 7.1b with superimposed normal
approximation
![]() .
.
(i) For example,
![]()
![]() confidence interval for
confidence interval for
![]() is:
is:
![$\displaystyle \left[ \tanh \left(z - \frac{\Phi^{-1}(1-\alpha/2)}{\sqrt{n-3}}\right), \tanh \left(z + \frac{\Phi^{-1}(1-\alpha/2)}{\sqrt{n-3}}\right) \right]{},$](img2351.gif) |
If
![]() and
and ![]()
![]() ,
,
![]() and
and
![]() . In terms of
. In terms of ![]() the
the
![]() confidence interval is
confidence interval is
![]() .
.
(ii) Assume that two samples of size ![]() and
and ![]() , respectively,
are obtained form two different bivariate normal populations. We are
interested in testing
, respectively,
are obtained form two different bivariate normal populations. We are
interested in testing
![]() against the two sided
alternative. After observing
against the two sided
alternative. After observing ![]() and
and ![]() and transforming them to
and transforming them to
![]() and
and ![]() , we conclude that the
, we conclude that the ![]() -value of the test is
-value of the test is
![]() .
.
As an illustration, we apply the Box-Cox transformation to apparently skewed data of CEO salaries.
Forbes magazine published data on the best small firms in 1993. These
were firms with annual sales of more than five and less than ![]() million. Firms were ranked by five-year average return on
investment. One of the variables extracted is the annual salary of the
chief executive officer for the first
million. Firms were ranked by five-year average return on
investment. One of the variables extracted is the annual salary of the
chief executive officer for the first ![]() ranked firms (since one
datum is missing, the sample size is
ranked firms (since one
datum is missing, the sample size is ![]() ). Figure 7.2a
shows the histogram of row data (salaries). The data show moderate
skeweness to the right. Figure 7.2b gives the values of
likelihood in (7.2) for different values of
). Figure 7.2a
shows the histogram of row data (salaries). The data show moderate
skeweness to the right. Figure 7.2b gives the values of
likelihood in (7.2) for different values of ![]() . Note
that (7.2) is maximized for
. Note
that (7.2) is maximized for ![]() approximately equal
to
approximately equal
to ![]() . Figure 7.2c gives the transformed data by
Box-Cox transformation with
. Figure 7.2c gives the transformed data by
Box-Cox transformation with
![]() . The histogram of
transformed salaries is notably symetrized.
. The histogram of
transformed salaries is notably symetrized.
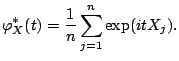
The characteristic function of a probability distribution ![]() is
defined as its Fourier-Stieltjes transform,
is
defined as its Fourier-Stieltjes transform,
| (7.3) |
For a sample
![]() one defines empirical
characteristic function
one defines empirical
characteristic function
![]() as
as
 |
![$\displaystyle P\left[ \lim_{n \rightarrow \infty} \sup_{\vert t\vert \leq T} \vert\varphi^{\ast}(t) - \varphi(t)\vert=0 \right]=1$](img2386.gif) |
Following Murata (2001)[20] we describe how the empirical characteristic function can be used in testing for the independence of two components in bivariate distributions.
Given the bivariate sample
![]() ,
,
![]() , we are
interested in testing for independence of the components
, we are
interested in testing for independence of the components ![]() and
and ![]() .
The test can be based on the following bivariate process,
.
The test can be based on the following bivariate process,
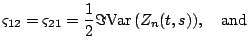
Murata (2001)[20] shows that ![]() has Gaussian weak
limit and that
has Gaussian weak
limit and that
![$\displaystyle \varsigma_{11} = \frac{1}{2} \left[\Re \mathrm{Var}\,\left(Z_n(t,s)\right) + \mathrm{Cov}\,\left(Z_n(t,s), \overline{ Z_n(t,s)} \right)\right]$](img2403.gif) |
|
 |
|
![$\displaystyle \varsigma_{22} = \frac{1}{2} \left[ - \Re \mathrm{Var}\,\left(Z_n...
...)\right) + \mathrm{Cov}\,\left(Z_n(t,s), \overline{ Z_n(t,s)} \right)\right]{}.$](img2405.gif) |
![\includegraphics[width=3.57cm]{text/2-7/figurema.eps}](img2409.gif) (a) (a)
![\includegraphics[width=3.5cm]{text/2-7/figuremb.eps}](img2410.gif) (b) (b)
![\includegraphics[width=3.55cm]{text/2-7/figuremc.eps}](img2411.gif) (c) (c) |
We generated two independent components from the Beta(![]() )
distribution of size
)
distribution of size ![]() and found
and found ![]() statistics and
corresponding
statistics and
corresponding ![]() -values
-values ![]() times. Figure 7.3a,b
depicts histograms of
times. Figure 7.3a,b
depicts histograms of ![]() statistics and
statistics and ![]() values based on
values based on
![]() simulations. Since the generated components
simulations. Since the generated components ![]() and
and ![]() are
independent, the histogram for
are
independent, the histogram for ![]() agrees with asymptotic
agrees with asymptotic ![]() distribution, and of course, the
distribution, and of course, the ![]() -values are uniform on
-values are uniform on ![]() .
In Fig. 7.3c we show the
.
In Fig. 7.3c we show the ![]() -values when the components
-values when the components
![]() and
and ![]() are not independent. Using two independent Beta(
are not independent. Using two independent Beta(![]() )
components
)
components ![]() and
and ![]() , the second component
, the second component ![]() is constructed as
is constructed as
![]() . Notice that for majority of
simulational runs the independence hypothesis is rejected, i.e., the
. Notice that for majority of
simulational runs the independence hypothesis is rejected, i.e., the
![]() -values cluster around 0.
-values cluster around 0.
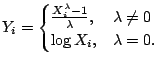
![$\displaystyle (\lambda - 1) \sum_{i=1}^n \log X_i - \frac{n}{2} \log\left[ \frac{1}{n} \sum_{i=1}^n \left(Y_i - \bar{Y}_i\right)^2 \right]{},$](img2371.gif)
![\includegraphics[width=3.5cm]{text/2-7/figure2a.eps}](img2377.gif) (a)
(a)
![\includegraphics[width=3.65cm]{text/2-7/figure2b.eps}](img2378.gif) (b)
(b)
![\includegraphics[width=3.5cm]{text/2-7/figure2c.eps}](img2379.gif) (c)
(c)