10.2 Estimation of the Factor Model
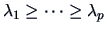
In practice, we have to find estimates
 of the
loadings
of the
loadings  and estimates
  of the specific
variances
of the specific
variances  such that analogously to (10.7)
where  denotes the empirical covariance of
  .
Given an estimate
of , it is natural to set
.
Given an estimate
of , it is natural to set
We have that
 is an estimate
for the communality
is an estimate
for the communality  .
.
In the ideal case  , there is an exact solution. However,
 is usually greater than zero, therefore we have to find
and
such that
is usually greater than zero, therefore we have to find
and
such that  is approximated by
 . As mentioned above, it is often easier to compute
the loadings and the specific variances of the standardized model.
. As mentioned above, it is often easier to compute
the loadings and the specific variances of the standardized model.
Define
 , the standardization of the data
matrix , where, as usual,
, the standardization of the data
matrix , where, as usual,
 and the
centering matrix
and the
centering matrix
 (recall from Chapter 2
that
(recall from Chapter 2
that
 ).
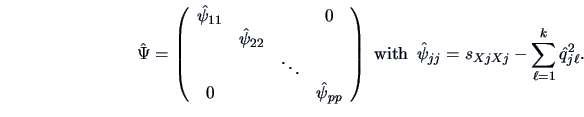
The estimated factor loading matrix
).
The estimated factor loading matrix
 and the estimated specific variance
 of
of  are
are

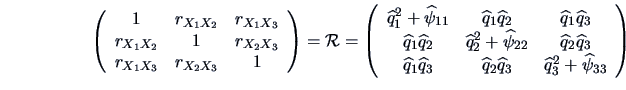
For the correlation matrix  of , we have that

The interpretations of the factors are formulated
from the analysis of the loadings
.
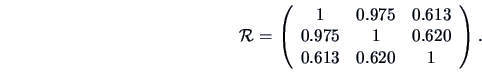
EXAMPLE 10.3
Let us calculate the matrices just defined for the car data given in
Table
B.7.
This data set consists of the averaged marks (from

low to

high)
for

car types. Considering the three variables price,
security and easy handling, we get the following correlation matrix:
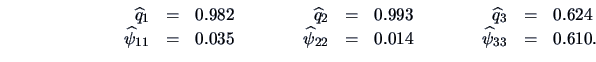
We will first look for one factor, i.e.,

. Note that
(# number of parameters of

unconstrained - # parameters of
constrained) is equal to
.
This implies that there is an exact solution! The equation
yields the communalities

, where
Combining this with the specific variances

,

and

,
we obtain the following solution
Since the first two communalities (
)
are close to one, we can conclude that
the first two variables, namely price and security,
are explained by the single factor quite well. This factor can be
interpreted as a ``price+security'' factor.
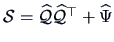
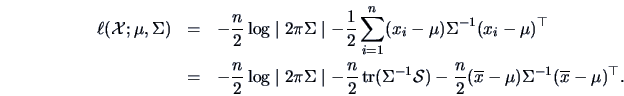
Recall from Chapter 6 the log-likelihood function  for a data matrix of observations of
 :
:
This can be rewritten as
Replacing  by
by
 and
substituting
and
substituting
 this becomes
![\begin{displaymath}
\ell({\data{X}};\widehat \mu,{\data{Q}},\Psi)
= -\frac{n}{2...
...{tr}}\{({\data{QQ}}^{\top} + \Psi)^{-1}{\data{S}}\} \right].
\end{displaymath}](mvahtmlimg3104.gif) |
(10.13) |
Even in the case of a single factor (),
these equations are rather complicated and
iterative numerical algorithms have to be used
(for more details see Mardia et al. (1979, p. 263ff)).
A practical computation scheme is also given in Supplement 9A of
Johnson and Wichern (1998).
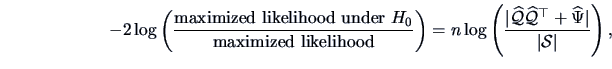
Using the methodology of Chapter 7, it is easy to test the adequacy
of the factor analysis model by comparing the likelihood under the null
(factor analysis) and alternative (no constraints on covariance matrix)
hypotheses.
Assuming that
and
 are the maximum likelihood
estimates corresponding to (10.13), we obtain the following
LR test statistic:
are the maximum likelihood
estimates corresponding to (10.13), we obtain the following
LR test statistic:
 |
(10.14) |
which asymptotically has the
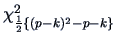 distribution.
The  approximation can be improved if we replace
  by
by
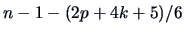 in (10.14) (Bartlett; 1954).
Using Bartlett's correction,
we reject the factor analysis model at the
in (10.14) (Bartlett; 1954).
Using Bartlett's correction,
we reject the factor analysis model at the  level if
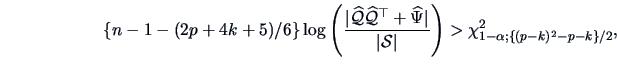 |
(10.15) |
and if the number of observations is large and
the number of common factors  is such that the statistic
has a positive number of degrees of freedom.
is such that the statistic
has a positive number of degrees of freedom.
The Method of Principal Factors
The method of principal factors concentrates on the decomposition
of the correlation matrix or the covariance matrix .
For simplicity, only the method for the
correlation matrix will be discussed.
As pointed out in Chapter 9, the
spectral decompositions of and
yield different results and therefore, the method of principal factors
may result in different estimators. The method can be motivated as
follows: Suppose we know the exact , then the constraint
(10.12) implies that the columns of are orthogonal
since
 and it implies that they are
eigenvectors of
and it implies that they are
eigenvectors of
 .
Furthermore, assume that the first
eigenvalues are positive. In this case we could calculate
by means of a spectral decomposition of
.
Furthermore, assume that the first
eigenvalues are positive. In this case we could calculate
by means of a spectral decomposition of
 and would be the number of factors.
The principal factors algorithm is based on
good preliminary estimators
 of the communalities
 , for
, for  .
There are two traditional proposals:
.
There are two traditional proposals:
-
 , defined as the square of the multiple correlation
coefficient of
, defined as the square of the multiple correlation
coefficient of  with
with
 , for
, for  , i.e.,
 with
with  ,
,
 and where
 is
the least squares regression parameter of a regression of
is
the least squares regression parameter of a regression of  on
on  .
.
-
 ,
where
,
where
 is the correlation matrix of
  .
.
Given
 we can construct
the reduced correlation matrix,
we can construct
the reduced correlation matrix,
 .
The Spectral Decomposition Theorem says that
.
The Spectral Decomposition Theorem says that
with eigenvalues
 .
Assume that the first
eigenvalues
.
Assume that the first
eigenvalues
 are positive and large
compared to the others.
Then we can set
are positive and large
compared to the others.
Then we can set

or
with

In the next step set
Note that the procedure can be iterated: from
 we can compute a new reduced correlation matrix
 following the same procedure. The iteration usually stops when the
have converged to a stable value.
following the same procedure. The iteration usually stops when the
have converged to a stable value.
EXAMPLE 10.4
Consider once again the car data given in Table
B.7.
From Exercise
9.4 we know that the first PC is
mainly influenced by

-

.
Moreover, we know that most of the variance
is already captured by the first PC. Thus we can conclude that the
data are mainly determined by one factor (
).
Figure 10.1:
Loadings of the evaluated car qualities, factor analysis with  .
.
 MVAfactcarm.xpl
|
|
The eigenvalues of
 for
for
 are
are
It would suffice to choose only one factor.
Nevertheless, we have computed two factors. The result (the factor loadings
for two factors) is shown in Figure
10.1.
We can clearly see a cluster of points to the right, which contain the
factor loadings for the variables -. This shows, as did the
PCA, that these variables are highly dependent and are thus more or less
equivalent. The factor loadings for  (economy) and
  (easy handling) are separate, but note the different scales on the
horizontal and vertical axes! Although there are two or three sets of variables
in the plot, the variance is already explained by the first
factor, the ``price+security'' factor.
(easy handling) are separate, but note the different scales on the
horizontal and vertical axes! Although there are two or three sets of variables
in the plot, the variance is already explained by the first
factor, the ``price+security'' factor.
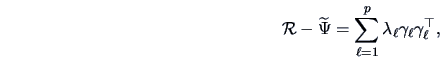
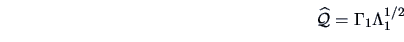
The Principal Component Method
The principal factor method involves finding an approximation
 of , the matrix of specific variances,
and then correcting
of , the matrix of specific variances,
and then correcting  ,
the correlation matrix of
,
the correlation matrix of  , by . The principal component method starts with an approximation
 of
of  , the factor loadings matrix. The sample covariance matrix is
diagonalized,
, the factor loadings matrix. The sample covariance matrix is
diagonalized,
 .
Then the first eigenvectors are retained to build
.
Then the first eigenvectors are retained to build
![\begin{displaymath}
\hat{\data{Q}}= [\sqrt{\lambda_{1}} \gamma_{1}, \ldots, \sqrt{\lambda_{k}} \gamma_{k}].
\end{displaymath}](mvahtmlimg3141.gif) |
(10.16) |
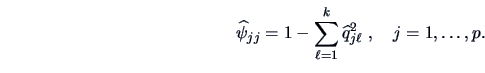
The estimated specific variances are provided by the diagonal elements of the
matrix
 ,
,
 |
(10.17) |
By definition, the diagonal elements of  are equal to the diagonal elements
of
are equal to the diagonal elements
of
 . The off-diagonal elements
are not necessarily estimated. How good then is this approximation?
Consider the residual matrix
. The off-diagonal elements
are not necessarily estimated. How good then is this approximation?
Consider the residual matrix
resulting from the principal component solution.
Analytically we have that
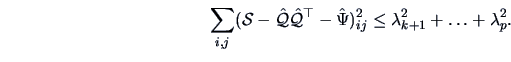
This implies that a small value of the neglected eigenvalues can result
in a small approximation error.
A heuristic device for selecting the number of factors is to consider the proportion
of the total sample variance due to the  -th factor. This quantity is in general equal to
- (A)
-
 for a factor analysis of ,
- (B)
 for a factor analysis of .
EXAMPLE 10.5
This example uses a consumer-preference study from
Johnson and Wichern (1998).
Customers were
asked to rate several attributes of a new product. The responses
were tabulated and the following
correlation matrix
was constructed:
| Attribute (Variable) |
|
|---|
| Taste |
1 |
| Good buy for money |
2 |
| Flavor |
3 |
| Suitable for snack |
4 |
| Provides lots of energy |
5 |
|
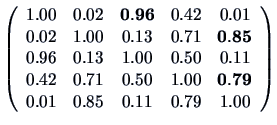 |
The bold entries of
show that variables 1 and 3 and variables 2 and 5
are highly correlated.
Variable 4 is more correlated with variables 2 and 5 than with variables
1 and 3.
Hence, a model with 2 (or 3) factors seems to be reasonable.
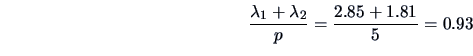
The first two eigenvalues
 and
and
 of are the only eigenvalues greater than
one. Moreover, common factors account for a
cumulative proportion
of are the only eigenvalues greater than
one. Moreover, common factors account for a
cumulative proportion
of the total (standardized) sample variance.
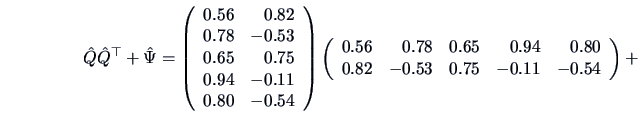
Using the principal component method, the estimated factor
loadings, communalities, and specific variances, are calculated from
formulas (
10.16) and (
10.17),
and the results are given in Table
10.1.
Table 10.1:
Estimated factor loadings, communalities, and specific variances
| |
|
Estimated factor |
|
Specific |
| |
|
loadings |
Communalities |
variances |
| Variable |
 |
 |
 |
 |
| 1. |
Taste |
0.56 |
0.82 |
0.98 |
0.02 |
| 2. |
Good buy for money |
0.78 |
-0.53 |
0.88 |
0.12 |
| 3. |
Flavor |
0.65 |
0.75 |
0.98 |
0.02 |
| 4. |
Suitable for snack |
0.94 |
-0.11 |
0.89 |
0.11 |
| 5. |
Provides lots of energy |
0.80 |
-0.54 |
0.93 |
0.07 |
| Eigenvalues |
2.85 |
1.81 |
|
|
| Cumulative proportion of total
(standardized) sample variance |
0.571 |
0.932 |
|
|
|
Take a look at:
This nearly reproduces the correlation matrix
.
We conclude that the two-factor model provides a good fit of the
data. The communalities
indicate that
the two factors account for a large percentage of the sample
variance of each variable.
Due to the nonuniqueness of factor loadings,
the interpretation might be enhanced
by rotation. This is the topic of the next subsection.
Rotation
The constraints (10.11) and (10.12) are given as a matter of
mathematical
convenience (to create unique solutions) and can therefore complicate the
problem of interpretation. The interpretation of the loadings would be
very simple if the variables could be split into disjoint sets,
each being
associated with one factor. A well known analytical algorithm to rotate
the loadings is given by the varimax rotation method proposed by Kaiser (1985).
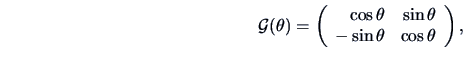
In the simplest case of factors, a rotation matrix  is given by
representing a clockwise rotation of the coordinate axes by the
angle  . The corresponding rotation of loadings is calculated
via
. The corresponding rotation of loadings is calculated
via
 .
The idea of the varimax method is to find the angle
that maximizes
the sum of the variances of the squared loadings
.
The idea of the varimax method is to find the angle
that maximizes
the sum of the variances of the squared loadings  within each column
of
within each column
of
 .
More precisely, defining
.
More precisely, defining
 , the
varimax criterion chooses
so that
, the
varimax criterion chooses
so that
is maximized.
EXAMPLE 10.6
Let us return to the marketing example of
Johnson and Wichern (1998)
(Example
10.5).
The basic factor loadings given in Table
10.1 of
the first factor and a second factor are almost identical
making it difficult to interpret the factors.
Applying the varimax rotation we obtain the loadings
and
.
The high loadings, indicated as bold entries,
show that variables 2, 4, 5 define
factor 1, a nutricional factor. Variable 1 and 3 define factor 2 which
might be referred to as a taste factor.
Summary

-
In practice, and have to be estimated from
 . The
number of parameters is
. The
number of parameters is
 .
.
-
If , then there exists an exact solution.
In practice, is usually greater than
 , thus approximations must be
considered.
, thus approximations must be
considered.
-
The maximum-likelihood method assumes a normal distribution for the
data. A solution can be found using numerical algorithms.
-
The method of principal factors is a two-stage method which
calculates
from the reduced correlation matrix
, where
 is a pre-estimate of .
The final estimate of is found by
is a pre-estimate of .
The final estimate of is found by
 .
.
-
The principal component method is based on an
approximation,
, of .
-
Often a more informative interpretation of the factors
can be found by rotating the factors.
-
The varimax rotation chooses a rotation that maximizes
![$\data{V}=\frac{1}{p}\sum^{k}_{\ell=1}
\left[ \sum^{p}_{j=1}\left(\tilde q^{*}_{...
...\frac{1}{p} \sum^{p}_{j=1}\left(\tilde q^{*}_{jl}\right)^{2} \right\}^2
\right]$](mvahtmlimg3172.gif) .
.

![\begin{displaymath}
\data{V}=\frac{1}{p}\sum^{k}_{\ell=1}
\left[ \sum^{p}_{j=1}\...
...{p}_{j=1}\left(\tilde q^{*}_{jl}\right)^{2} \right\}^2
\right]
\end{displaymath}](mvahtmlimg3165.gif)
![\includegraphics[width=1\defpicwidth]{factcar.ps}](mvahtmlimg3134.gif)