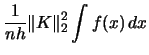
| (3.11) | |||
 |
|||
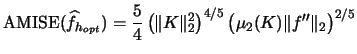
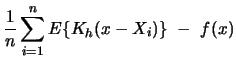
Let us now turn to the statistical properties of kernel density estimators. We are interested in the mean squared error since it combines squared bias and variance.
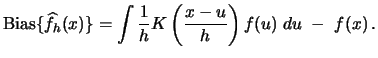
For the bias we have
Observe from (3.13)
that the bias is proportional to
![]() . Hence, we have to choose a small
. Hence, we have to choose a small ![]() to reduce the bias.
Moreover,
to reduce the bias.
Moreover,
![]() depends on
depends on ![]() , the curvature of the density at
, the curvature of the density at ![]() .
The effects of this dependence are illustrated in
Figure 3.6 where the dashed lines mark
.
The effects of this dependence are illustrated in
Figure 3.6 where the dashed lines mark
![]() and the solid line
the true density
and the solid line
the true density
![]() . The bias is thus
given by the vertical difference between the dashed and the solid
line.
. The bias is thus
given by the vertical difference between the dashed and the solid
line.
Note that in ``valleys" of ![]() the bias is positive
since
the bias is positive
since ![]() around a
local minimum of
around a
local minimum of ![]() . Consequently, the dashed line is always above
the solid line. Near peaks of
. Consequently, the dashed line is always above
the solid line. Near peaks of ![]() the opposite is true.
The magnitude of the bias depends on the curvature of
the opposite is true.
The magnitude of the bias depends on the curvature of ![]() ,
reflected in the absolute value of
,
reflected in the absolute value of ![]() . Obviously, large values of
. Obviously, large values of
![]() imply large values of
imply large values of
![]() .
.
For the variance we calculate
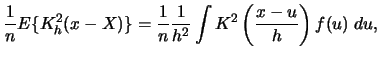
Notice that the variance of the kernel density estimator is
nearly proportional to ![]() . Hence, in order to make the
variance small we have to choose a fairly large
. Hence, in order to make the
variance small we have to choose a fairly large ![]() . Large values
of
. Large values
of ![]() mean bigger intervals
mean bigger intervals
![]() more observations in each
interval and hence more observations that get non-zero weight in the
sum
more observations in each
interval and hence more observations that get non-zero weight in the
sum
![]() . But, as you may recall from the
analysis of the properties of the sample mean in basic statistics,
using more observations in a sum will produce sums with less
variability.
. But, as you may recall from the
analysis of the properties of the sample mean in basic statistics,
using more observations in a sum will produce sums with less
variability.
Similarly, for a given value of ![]() (be it large or small),
increasing the sample size
(be it large or small),
increasing the sample size ![]() will decrease
will decrease
![]() and therefore reduce the variance. But this makes sense because
having a greater total number of observations means that, on
average, there will be more observations in each interval
and therefore reduce the variance. But this makes sense because
having a greater total number of observations means that, on
average, there will be more observations in each interval
![]()
Also observe that the variance is increasing in
![]() .
This term will be rather small for flat kernels
such as the Uniform kernel. Intuitively speaking, we might say
that smooth and flat kernels will produce less volatile
estimates in repeated sampling since in each sample all realizations are
given roughly equal weight.
.
This term will be rather small for flat kernels
such as the Uniform kernel. Intuitively speaking, we might say
that smooth and flat kernels will produce less volatile
estimates in repeated sampling since in each sample all realizations are
given roughly equal weight.
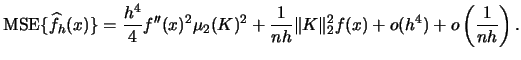
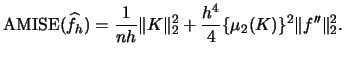
We have already seen for the histograms that choosing
the bandwidth ![]() is a crucial problem in nonparametric (density)
estimation. The kernel density estimator is no exception. If we
look at formulae (3.13) and (3.15) we can
see that we face the familiar trade-off between variance and bias.
We would surely like to keep both variance and bias small but
increasing
is a crucial problem in nonparametric (density)
estimation. The kernel density estimator is no exception. If we
look at formulae (3.13) and (3.15) we can
see that we face the familiar trade-off between variance and bias.
We would surely like to keep both variance and bias small but
increasing ![]() will lower the variance while it will raise the bias
(decreasing
will lower the variance while it will raise the bias
(decreasing ![]() will do the opposite). Minimizing the
will do the opposite). Minimizing the ![]() , i.e.
the sum between variance and squared bias
(cf. (2.20)),
represents a compromise between over- and
undersmoothing. Figure 3.7 puts variance, bias,
and
, i.e.
the sum between variance and squared bias
(cf. (2.20)),
represents a compromise between over- and
undersmoothing. Figure 3.7 puts variance, bias,
and ![]() onto one graph.
onto one graph.
![\includegraphics[width=1.2\defpicwidth]{SPMkdemse.ps}](spmhtmlimg660.gif)
|
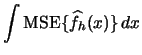
Moreover, looking at the ![]() provides a way of
assessing whether the kernel density estimator is consistent. Recall
that convergence in mean square implies convergence in probability
which is consistency. (3.13) and
(3.15) yield
provides a way of
assessing whether the kernel density estimator is consistent. Recall
that convergence in mean square implies convergence in probability
which is consistency. (3.13) and
(3.15) yield
In the case of the histogram we were able to reduce the
dimensionality of the problem (in some sense) by using the
![]() instead of the
instead of the ![]() , the former having the added advantage of
being a global rather than a local measure of estimation accuracy.
Hence, in the following subsections we will turn our attention to the
, the former having the added advantage of
being a global rather than a local measure of estimation accuracy.
Hence, in the following subsections we will turn our attention to the
![]() and derive the
and derive the ![]() -optimal bandwidth.
-optimal bandwidth.
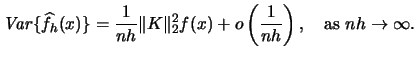
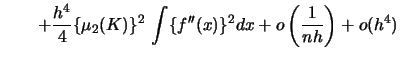
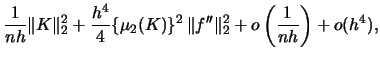
For the kernel density estimator the ![]() is given by
is given by
 |
(3.17) | ||
 |
|||
 |
|||
 |
|||
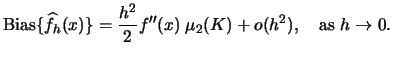
![\includegraphics[width=1.2\defpicwidth]{SPMkdebias.ps}](spmhtmlimg641.gif)
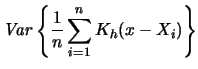
![$\displaystyle \frac{1}{n} \big(E\{K^{2}_{h}(x-X)\}-[E\{K_{h}(x-X)\}]^{2}\big)$](spmhtmlimg649.gif)