and it becomes unimportant as
The dynamics of asset prices are reflected by uncertain movements of their values over time. Cuthbertson (1996, ch. 5) and Wilmott et al. (1997, ch. 2) state that the efficient market hypothesis (EMH) is one possible reason for the random behavior of the asset price. In spite of its different forms, the EMH basically states that past history is fully reflected in present prices and markets respond immediately to any new information about the asset. These two assumptions imply that changes in the asset price are a Markov process.
In this context, modelling the asset price is concerned with
modelling the arrival of new information, which affects the price.
Depending on the appearance of the so called "normal" and "rare"
events, there are two basic blocks in modelling the
continuous-time asset price. Neftci (2000, ch. 8) states that
the main difference between the "normal" and the "rare" behavior
concerns the size of the events and their probability to occur. As
the interval of observation (![]() ) gets smaller, the size of
"normal" events also gets smaller
) gets smaller, the size of
"normal" events also gets smaller
and it becomes unimportant as
![]() .
Even in a short time interval, there is always a
non-zero probability that some non-noticeable news will arrive. In
contrast to a "normal" event, when a "rare" event (or shock)
occurs, the value of the random variable can change significantly
over a short period of time. An example of a "rare" event is a
market crash, such as the one that occurred in 1987. In other
words, as
.
Even in a short time interval, there is always a
non-zero probability that some non-noticeable news will arrive. In
contrast to a "normal" event, when a "rare" event (or shock)
occurs, the value of the random variable can change significantly
over a short period of time. An example of a "rare" event is a
market crash, such as the one that occurred in 1987. In other
words, as
![]() , the probability of a "rare" event
moves to zero, but its size may not shrink.
, the probability of a "rare" event
moves to zero, but its size may not shrink.
If markets are dominated by "normal" events, then a Brownian motion process can be used. This is a continuous-time stochastic process, where extremes occur only infrequently according to the probabilities in the tails of the normal distribution. The continuous-time diffusion (Brownian motion-based) process is written in form of the following stochastic differential equation for the asset return:
These asset returns follow the so called geometric Brownian
motion. Expression (11.1) is called a differential equation,
because the asset price ![]() is only defined implicitly by
describing its changes through time. Since this process has a
continuous-time sample path, it does not allow for discontinuities
or jumps in its values when "rare" events occur. In this case, the
Poisson jump process can be useful. In particular, the time series
of the asset price can be modelled as the sum of the
continuous-time diffusion process and Poisson jump processes.
XploRe
uses the Merton jump-diffusion model to simulate and
estimate simultaneously the "normal" and "rare" events in the
asset price. The stochastic differential equation for
is only defined implicitly by
describing its changes through time. Since this process has a
continuous-time sample path, it does not allow for discontinuities
or jumps in its values when "rare" events occur. In this case, the
Poisson jump process can be useful. In particular, the time series
of the asset price can be modelled as the sum of the
continuous-time diffusion process and Poisson jump processes.
XploRe
uses the Merton jump-diffusion model to simulate and
estimate simultaneously the "normal" and "rare" events in the
asset price. The stochastic differential equation for ![]() is:
is:
Jump-diffusion models undoubtedly capture a real phenomenon that is missing from the Black-Scholes models. Yet, they are rarely used in practice. There are three main reasons for this, difficulty in parameter estimation, solution and impossibility of perfect hedging (Wilmott; 1999, ch. 26).
XploRe offers the following three quantlets to simulate and estimate the price of the underling asset according to (11.1) and (11.2):
|
The quantlet
 stocksim
provides three means to simulate the
asset price as a random process by using i) the geometric Brownian
motion (11.1), ii) a compounded Poisson jump process with
the lognormal distribution of the jump height and iii) a mixture
of both, namely the Merton jump-diffusion model (11.2).
stocksim
provides three means to simulate the
asset price as a random process by using i) the geometric Brownian
motion (11.1), ii) a compounded Poisson jump process with
the lognormal distribution of the jump height and iii) a mixture
of both, namely the Merton jump-diffusion model (11.2).
If a direct approach is preferable, then the following input
parameters have to be defined: ![]() - the starting value of
the underlying asset,
- the starting value of
the underlying asset,
![]() - the volatility of the asset
return for the continuous-time diffusion process,
- the volatility of the asset
return for the continuous-time diffusion process, ![]() -
time (days) to expiration,
-
time (days) to expiration,
![]() - shocks per days,
- shocks per days,
![]() - the expected number of jumps, which corresponds to
- the expected number of jumps, which corresponds to
![]() in the Poisson process and
in the Poisson process and
![]() - the
volatility of the jump height. The following example simulates the
asset price by directly giving the values of the input parameters.
- the
volatility of the jump height. The following example simulates the
asset price by directly giving the values of the input parameters.
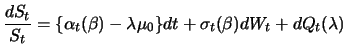
The quantlet returns a display as output (Figure 11.1), where all three processes are plotted together.
In the example above, the stock price is simulated at 400 points.
The number of discretization points ![]() is calculated as a
product of days to expirations
is calculated as a
product of days to expirations ![]() and
and
![]() (shocks) per day. The jump consists of two random variables: one
for the shock arrival process, which is Poisson distributed with
parameter
(shocks) per day. The jump consists of two random variables: one
for the shock arrival process, which is Poisson distributed with
parameter ![]() and the other one for the jump size, which is
log-normal distributed with volatility
and the other one for the jump size, which is
log-normal distributed with volatility
![]() . A jump is
detected if
. A jump is
detected if
![]() , where
, where ![]() is a
random variable with a standard uniform distribution, i.e.
is a
random variable with a standard uniform distribution, i.e.
![]() . For the mixed process, the geometric Brownian motion is
simulated with an overlaying Poisson process.
. For the mixed process, the geometric Brownian motion is
simulated with an overlaying Poisson process.
For a given dataset, the quantlet
stockest
estimates the
parameters of a random process, when the asset returns are assumed
to follow either a geometric Brownian motion, as in (11.1),
or a mix of the geometric Brownian motion and of a compounded
Poisson Jump Process, namely the Merton jump-diffusion process
given in (11.2). The following illustrates
stockest
on the data for Motorola stock prices.
The output window contains the following information:
When no jumps are assumed, the estimated parameters for ![]() and
and
![]() are 7.0066 and 44.191, respectively. The intensity of the
Poisson process is
are 7.0066 and 44.191, respectively. The intensity of the
Poisson process is ![]() . When the jump-diffusion process is
assumed, then the estimated values for
. When the jump-diffusion process is
assumed, then the estimated values for ![]() ,
, ![]() and the
jump volatility are 3.2302, 38.819 and 10.9, respectively.
and the
jump volatility are 3.2302, 38.819 and 10.9, respectively.
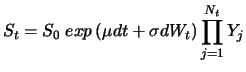
The quantlet
stockestsim
is a combination of both
stocksim
and
stockest
. First, the parameters for
the given dataset are estimated for both, the Brownian motion
based and the compounded Poisson jump process. Then both models
are compared with the real dataset by means of a simulation.
stockestsim
is illustrated in the following example. The
results are graphically displayed in Figure (11.2).
The stochastic process for asset price movement, when only "normal" events are considered, is assumed to be continuous in time, so that analytical tools, such as stochastic calculus can be employed. In general, the asset price is assumed to follow a Markov process, which means that only the present value of the asset price is relevant for the future price movements. This feature is consistent with the weak form of market efficiency, which assumes that the present value of the asset price already involves all information contained in past prices and history is irrelevant.
A special case of a Markov process is the Brownian motion. The
Brownian motion with drift is defined as a stochastic process
![]() with the following properties:
with the following properties:
Fluctuations in asset price can be explained by using the following stochastic differential equation, also known as Ito's process:
The first term ![]() represents the deterministic return within
a short interval
represents the deterministic return within
a short interval ![]() , where
, where ![]() is the average growth rate of
the asset price. The second term
is the average growth rate of
the asset price. The second term
![]() , where
, where ![]() is
assumed to be constant, takes into account the random changes of
the asset price to external effects, such as unexpected news.
is
assumed to be constant, takes into account the random changes of
the asset price to external effects, such as unexpected news.
Brownian motion and normal distribution have been widely used in the Black-Scholes option pricing framework (section 11.2). However, two puzzles have emerged from several empirical investigations and are subject to current research. These are the leptokurtic distribution of asset returns and evidence on volatility smile (section 11.5).
A distribution is leptokurtic, if it has a higher peak and heavier tails than those of the normal distribution. One possible reason for fat tails can be the discontinuous path of the asset returns. To reflect this discontinuity, jump-diffusion processes have been widely used to model financial time series. The jump-diffusion model gives higher values than the Black-Scholes model for deep out-of-the-money and in-the-money options, especially when the time to maturity is short. The main reason for this is that a jump-diffusion process results in a distribution with fatter tails than the normal distributed returns (log-normal asset price). For low values of gamma, the jump-diffusion model gives similar results as the Black-Scholes model.
Merton (1976) was one of the first, who applied Poisson
jumps to normal Brownian motion process, in order to approximate
the movement of stock prices subject to occasional discontinuous
breaks. In this section the concept behind the jump-diffusion
model is described following Merton (1976), and the later
works of Jiang (1998) and Neftci (2000, ch. 8 and ch. 7.2).
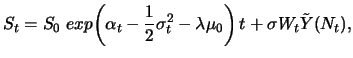
In the jump-diffusion model, changes in the asset price are a
mixture of normal events that occur in continuous fashion and of
rare events, which are modelled as jumps that occur sporadically.
The continuous component of the change in the asset price is a
Wiener process. The jump component is a Poisson-driven process. It
is assumed that the arrivals of rare events are independently,
identically distributed (i.i.d.). The probability of a jump that
occurs during a time interval of length ![]() is written as
is written as
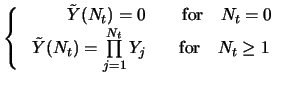
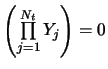
The jump process can be modelled using a Poisson counting process, which has the following properties:
Note that the time interval between two successive jumps is
exponentially distributed with parameter ![]() . Given that the
rare event occurs in the time interval
. Given that the
rare event occurs in the time interval ![]() causing a jump,
the asset price
causing a jump,
the asset price ![]() at time
at time ![]() will be the random
variable
will be the random
variable
![]() . The discontinuous change in the asset
price will be
. The discontinuous change in the asset
price will be
![]() . The random variable
. The random variable ![]() ,
also called the jump size, gives the percentage change in the
stock price, if the Poisson event occurs. In general,
,
also called the jump size, gives the percentage change in the
stock price, if the Poisson event occurs. In general, ![]() may be a random variable. It is assumed that the successive jump
sizes (
may be a random variable. It is assumed that the successive jump
sizes (
![]() ) are i.i.d.
) are i.i.d.
One aspect of the jump should once again be highlighted. The process has two sources of randomness. The occurrence of a jump is a random event. But once the jump occurs, the size of the jump is also random. Moreover, it is assumed that these two sources of randomness are independent of each other. Under this structure, the general parametric jump-diffusion process, as a mixture of both, continuous diffusion path and discontinuous jump path, can be written in general form as (Jiang; 1998):
Both, the Wiener process ![]() and the Poisson process
and the Poisson process
![]() are infinitely divisible in time and appropriated
scaled;
are infinitely divisible in time and appropriated
scaled;
![]() and
and ![]() are statistically independent.
By definition
are statistically independent.
By definition ![]() is the mean jump size. Thus, the expected
change in
is the mean jump size. Thus, the expected
change in ![]() from the jump component
from the jump component ![]() over the time
interval
over the time
interval ![]() is
is
![]() . Therefore, if
. Therefore, if ![]() denotes the total expected return (rate of change) on
denotes the total expected return (rate of change) on ![]() ,
,
![]() needs to be subtracted from the drift term of
needs to be subtracted from the drift term of
![]() :
:
Note, that a sample path ![]() for a process described by equation
(11.5) will be continuous most of the time, but has
finite jumps of different signs and sizes at discrete points in
time. Assuming
for a process described by equation
(11.5) will be continuous most of the time, but has
finite jumps of different signs and sizes at discrete points in
time. Assuming ![]() and
and ![]() are constant, so that the
continuous component of
are constant, so that the
continuous component of ![]() is lognormally distributed, and
conditional upon there being
is lognormally distributed, and
conditional upon there being ![]() jumps in the time interval
(
jumps in the time interval
(![]() ), the asset price at time
), the asset price at time ![]() can be written as
can be written as
Special cases of this model include those by Press (1967)
with
![]() and
and
![]() ,
Merton (1976) with
,
Merton (1976) with
![]() ,
,
![]() and lognormal jumps, Lo (1998) with
and lognormal jumps, Lo (1998) with
![]() , i.e. the jump size is determined by the process
itself, and Ornstein-Uhlenbeck process with
, i.e. the jump size is determined by the process
itself, and Ornstein-Uhlenbeck process with
![]() and exponentially decaying jumps (see Gourieroux (2001, pp.
249-253) and Küchler et al. (1997, pp. 27-28)
for the explanation of the Ornstein-Uhlenbeck process).
and exponentially decaying jumps (see Gourieroux (2001, pp.
249-253) and Küchler et al. (1997, pp. 27-28)
for the explanation of the Ornstein-Uhlenbeck process).
In
XploRe
the geometric Brownian motion with i.i.d. lognormal
jumps is used to simulate and estimate the asset price in a mixed
process. This method was proposed by Merton (1976) and is
now known as the Merton's jump-diffusion Model. It assumes that in
equation (11.6)
![]() ,
,
![]() , and
, and
![]() , where all
, where all
![]() are constant.
Then the stochastic differential equation for
are constant.
Then the stochastic differential equation for ![]() is written as:
is written as:
 if
if 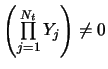 if
if 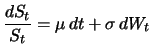
![\includegraphics[width=1.3\defpicwidth]{stocksim1.ps}](xlghtmlimg818.gif)
![\includegraphics[width=1.3\defpicwidth]{stockestsim1.ps}](xlghtmlimg824.gif)