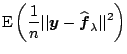
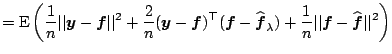
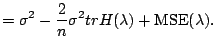
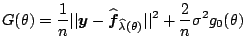
Let
![]() (
(![]() ) and
) and
![]() be measures of the
be measures of the
![]() and complexity for model
and complexity for model ![]() . A direct compromise
between these two conflicting quantities is
. A direct compromise
between these two conflicting quantities is
To be concrete, let us consider the regression
model (1.2). For a fixed ![]() , the
estimates are linear,
, the
estimates are linear,
![]() , where
, where
![]() for the trigonometric
model and
for the trigonometric
model and
![]() for the periodic
spline. Suppose that LS is used as the measure of GOF and
for the periodic
spline. Suppose that LS is used as the measure of GOF and
![]() . Let us first consider the case
when the error variance
. Let us first consider the case
when the error variance ![]() is known. Then the
criterion (1.19) can be re-expressed as
is known. Then the
criterion (1.19) can be re-expressed as
Other choices of ![]() were motivated from different
principles: AIC is an estimate of the expected
Kullback-Leibler discrepancy
where the second term
in (1.20) is considered as a bias correction
([10]) and BIC is an asymptotic Bayes
factor (Sect. 1.5). Since
each method was derived with different motivations, it is not
surprising that they have quite different theoretical
properties ([47]).
were motivated from different
principles: AIC is an estimate of the expected
Kullback-Leibler discrepancy
where the second term
in (1.20) is considered as a bias correction
([10]) and BIC is an asymptotic Bayes
factor (Sect. 1.5). Since
each method was derived with different motivations, it is not
surprising that they have quite different theoretical
properties ([47]). ![]() in (1.20)
can be considered as a penalty to the model
complexity. A larger penalty (
in (1.20)
can be considered as a penalty to the model
complexity. A larger penalty (![]() ) leads to a simpler
model. As a result, AIC and C
) leads to a simpler
model. As a result, AIC and C![]() perform well for ''complex'' true models and poorly for
''simple'' true models, while BIC does just the
opposite. In practice the nature of the true model,
''simple'' or ''complex'', is never known. Thus a data
driven choice of model complexity penalty
perform well for ''complex'' true models and poorly for
''simple'' true models, while BIC does just the
opposite. In practice the nature of the true model,
''simple'' or ''complex'', is never known. Thus a data
driven choice of model complexity penalty ![]() would be
desirable. Several methods have been proposed to estimate
would be
desirable. Several methods have been proposed to estimate
![]() ([41,43,4,42,48]). We
now discuss [48]'s method based on the
generalized degrees of
freedom. We will discuss
the cross-validation method
([43]) in the next section.
([41,43,4,42,48]). We
now discuss [48]'s method based on the
generalized degrees of
freedom. We will discuss
the cross-validation method
([43]) in the next section.
Now consider both ![]() and
and ![]() in (1.20) as unknown parameters. Denote
in (1.20) as unknown parameters. Denote
![]() as the selected model index based
on (1.20) for a fixed
as the selected model index based
on (1.20) for a fixed ![]() , and
, and
![]() as the estimate based on the
selected model. The dependence on
as the estimate based on the
selected model. The dependence on ![]() is made
explicit. We now want to find
is made
explicit. We now want to find ![]() which minimizes the
which minimizes the
![]()
 |
 |
 |
|
 |
 |
When ![]() is unknown, one may replace
is unknown, one may replace ![]() in (1.20) and (1.22) by
a consistent estimate. Many estimators were proposed in
literature
([44,17,14,23,15]).
The Rice's estimator is one of the simplest. For
model (1.2), [44] proposed to
estimate
in (1.20) and (1.22) by
a consistent estimate. Many estimators were proposed in
literature
([44,17,14,23,15]).
The Rice's estimator is one of the simplest. For
model (1.2), [44] proposed to
estimate ![]() by
by
 |
In the remaining of this chapter, ![]() is replaced by
is replaced by
![]() whenever necessary.
whenever necessary.
Another option, assuming the distribution of ![]() 's is known,
is to replace
's is known,
is to replace
![]() in (1.19) by
in (1.19) by
![]() . For the regression models
with Gaussian random errors, this leads to
. For the regression models
with Gaussian random errors, this leads to
Again, ![]() and
and
![]() correspond to
correspond to
![]() and
and
![]() criteria respectively. The same data-driven
procedure discussed above may also be used to select
criteria respectively. The same data-driven
procedure discussed above may also be used to select ![]() .
.
Derived from asymptotic argument, the
![]() method
may lead to over-fitting for small samples
([10,28]). The following
method
may lead to over-fitting for small samples
([10,28]). The following
![]() criterion modifies (1.23) with
a second order bias adjustment ([28])
criterion modifies (1.23) with
a second order bias adjustment ([28])
![]() should be used when the ratio between
should be used when the ratio between ![]() and the
number of parameters in the largest candidate model is small,
say less than 40 ([10]). In our trigonometric
model, the highest dimension may reach
and the
number of parameters in the largest candidate model is small,
say less than 40 ([10]). In our trigonometric
model, the highest dimension may reach ![]() . Thus we will use
. Thus we will use
![]() in our computations.
in our computations.
Now consider the trigonometric model. It is easy to check that criterion (1.20) reduces to
 |
Thus adding the ![]() th frequency reduces RSS by
th frequency reduces RSS by
![]() and
increases the complexity part by
and
increases the complexity part by
![]() . When
. When
![]() decreases
with increasing
decreases
with increasing ![]() , one should keeping adding
frequencies until
, one should keeping adding
frequencies until
![]() . It is not difficult to see that the
. It is not difficult to see that the
![]() criterion corresponds to applying
rule (1.18) with
criterion corresponds to applying
rule (1.18) with
![]() replaced by its
unbiased estimate
replaced by its
unbiased estimate
![]() . Other data-based thresholding can be found in
[15], [5], [61] and
[26].
. Other data-based thresholding can be found in
[15], [5], [61] and
[26].
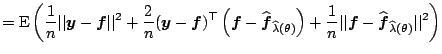
![\includegraphics[width=11.7cm]{text/3-1/criteria.eps}](img3419.gif) |
Fitting trigonometric models to the climate data, we plot
scores of
![]() ,
,
![]() and
and
![]() criteria as functions of the frequency in the
left panel of Fig. 1.6. The
criteria as functions of the frequency in the
left panel of Fig. 1.6. The
![]() and
and
![]() criteria reach minimum at
criteria reach minimum at ![]() and the
and the
![]() criterion reaches the minimum at
criterion reaches the minimum at ![]() . For a grid of
. For a grid of
![]() in the interval
in the interval
![]() , we calculate the
optimal
, we calculate the
optimal ![]() ,
,
![]() , based
on (1.20). We also calculate the estimated gdf
using
, based
on (1.20). We also calculate the estimated gdf
using ![]() and
and
![]() . The middle panel of
Fig. 1.6 shows the estimated gdf together with the
degrees of freedom based on the selected model,
. The middle panel of
Fig. 1.6 shows the estimated gdf together with the
degrees of freedom based on the selected model,
![]() . The gdf is intended to account for the extra
cost for estimating
. The gdf is intended to account for the extra
cost for estimating ![]() . As expected, the gdf is almost always larger
than the degrees of freedom. The gdf is close to the degrees of freedom when
. As expected, the gdf is almost always larger
than the degrees of freedom. The gdf is close to the degrees of freedom when
![]() is small or large. In the middle, it can have significant corrections
to the degrees of freedom. Overall, the gdf smoothes out the corners in the
discrete degrees of freedom. The RSS, complexity
is small or large. In the middle, it can have significant corrections
to the degrees of freedom. Overall, the gdf smoothes out the corners in the
discrete degrees of freedom. The RSS, complexity
![]() and
and ![]() are plotted in the right panel of
Fig. 1.6. The minimum of
are plotted in the right panel of
Fig. 1.6. The minimum of ![]() is reached at
is reached at
![]() with
with
![]() . Trigonometric model fits with
. Trigonometric model fits with
![]() and
and ![]() are shown in
Fig. 1.2.
are shown in
Fig. 1.2.
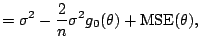
Fitting periodic spline models to the climate data, we plot
the
![]() (UBR) criterion in the left panel of
Fig. 1.7. Fits with the UBR choice of the
smoothing parameter is shown in the
right panel of Fig. 1.7.
(UBR) criterion in the left panel of
Fig. 1.7. Fits with the UBR choice of the
smoothing parameter is shown in the
right panel of Fig. 1.7.
![\includegraphics[width=11cm]{text/3-1/psfit.eps}](img3430.gif)