 |
(9.16) |
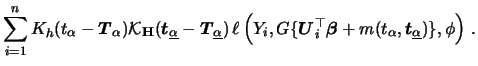
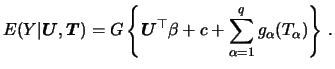
The most complex form of generalized models that we consider here is the GAPLM
For model (9.16), the backfitting and local scoring procedures
from Subsection 9.2.1 can be directly used. Since we have
a link function ![]() , the local scoring algorithm is used without any
changes. For the ``inner'' backfitting iteration, the algorithm is
adapted to a combination of parametric (linear) regression and
additive modeling. Essentially, the weighted smoother matrix
, the local scoring algorithm is used without any
changes. For the ``inner'' backfitting iteration, the algorithm is
adapted to a combination of parametric (linear) regression and
additive modeling. Essentially, the weighted smoother matrix
![]() is replaced by a weighted linear
projection matrix
is replaced by a weighted linear
projection matrix
The marginal integration approach for (9.16) is a subsequent application of the semiparametric ML procedure for the GPLM (see Chapter 7), followed by marginal integration (as introduced in Chapter 8) applied on the nonparametric component of the GPLM. For this reason we only sketch the complete procedure and refer for the details to Härdle et al. (2004).
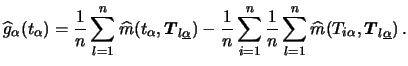
The key idea for estimating the GAPLM is the following: We use the
profile likelihood estimator for the GPLM with a
modification of the local likelihood function
(7.8):
As for the GPLM this local likelihood is maximized with respect
to the nonparametric component
![]() ,
this gives an estimate that does not (yet)
make use of th additive structure.
,
this gives an estimate that does not (yet)
make use of th additive structure.
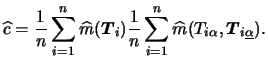
We apply the now marginal integration method to this pre-estimate. The final estimator is
To avoid numerical problems, in particular at boundary regions or in regions
of sparse data, a weight function
should be applied inside the averaging. More precisely, the final
estimate should calculated by:
 |
The expressions for bias and variance are
quite complex such that we omit them here.
We remark that
the correlation between the estimates of the components are of
higher order rate. Consequently, summing up the estimates would
give us a consistent estimate of the index function ![]() with
the one-dimensional nonparametric rate.
with
the one-dimensional nonparametric rate.
Härdle et al. (2004) also state that
the bias for the estimates
![]() is not
negligible. Therefore they propose a bias correction procedure using
(wild) bootstrap.
is not
negligible. Therefore they propose a bias correction procedure using
(wild) bootstrap.
To illustrate the GAPLM estimation we use the data set as in Example 5.1 selecting the most southern state (Sachsen) of East Germany. Recall that the data comprise the following explanatory variables:
![\includegraphics[width=1.3\defpicwidth]{SPMmigsd.ps}](spmhtmlimg2593.gif)
|
| Yes | No | (in %) | |||
| MIGRATION INTENTION | 39.6 | 60.4 | |||
| FAMILY/FRIENDS | 82.4 | 27.6 | |||
| UNEMPLOYED/JOB LOSS | 18.3 | 81.7 | |||
| CITY SIZE | 26.0 | 74.0 | |||
| FEMALE | 51.6 | 48.4 | |||
| Min | Max | Mean | S.D. | ||
| AGE | 18 | 65 | 40.37 | 12.69 | |
| INCOME | 200 | 4000 | 2136.31 | 738.72 |
| GLM | GAPLM | ||||
| Coefficients | S.E. | Coefficients | |||
| FAMILY/FRIENDS | 0.7604 | 0.1972 | 0.7137 | 0.7289 | |
| UNEMPLOYED/JOB LOSS | 0.1354 | 0.1783 | 0.447 | 0.1469 | 0.1308 |
| CITY SIZE | 0.2596 | 0.1556 | 0.085 | 0.3134 | 0.2774 |
| FEMALE | -0.1868 | 0.1382 | 0.178 | -0.1898 | -0.1871 |
| AGE (stand.) | -0.5051 | 0.0728 | -- | -- | |
| INCOME (stand.) | 0.0936 | 0.0707 | 0.187 | -- | -- |
| constant | -1.0924 | 0.2003 | -1.1045 | -1.1007 | |
We first show the density plots for the two continuous variables in Figure 9.3. Table 9.2 gives descriptive statistics for the data. In the following, AGE and INCOME have been standardized which corresponds to multiplying the bandwidths with the empirical standard deviations.
Table 9.3 presents on the left the results of a parametric logit estimation. Obviously, AGE has a significant linear impact on the migration intention whereas this does not hold for household income. On the right hand side of Table 9.3 we have listed the results for the linear part of the GAPLM. Since the choice of bandwidths can be crucial, we used two different bandwidths for the estimation. We see that the coefficients for the GAPLM show remarkable differences with respect to the logit coefficients. We can conclude that the impact of family/friends in the West seems to be overestimated by the parametric logit whereas the city size effect is larger for the semiparametric model. The nonparametric function estimates for AGE and INCOME are displayed in Figure 9.4.
![\includegraphics[width=1.3\defpicwidth]{SPMmigsf.ps}](spmhtmlimg2599.gif)
|
In contrast to Example 7.1 the GAPLM
allows us to include both, AGE and INCOME, as univariate
nonparametric functions. The interpretation of these
functions is much easier. We can easily see that the
component function for AGE is clearly monotone decreasing.
The nonparametric impact of INCOME, however, does not
vanish when the bandwidth is increased.
We will come back to this point when testing functional forms in
such models in the following section. ![]()